Since some time I'm using cloud resources provided by OVH for some projects I'm involved.
Recently we decided to give Zammad, an opensource support/ticketing solution, a try. We did choose the docker compose way for deployment, which also includes an elasticsearch instance. The important part of this information is, that for elasticsearch indexing the storage has a huge impact.
The documentation suggests at least 4 GB RAM for running the Zammad compose stack. So I did choose a VPS Cloud 2, it has 4 GB RAM and 50 GB Ceph storage, out of mind.
After I deployed my simple docker setup and on top the zammad compose setup everything was running smooth mostly. Unfortunately when starting the whole zammad compose stack, elasticsearch is regenerating the whole index, which might take a long(er) time depending on the size of the index and the performance of the system. This has to be done before the UI comes available and is ready for using.
To make a long story short, I had the same setup on a testground where it was several times faster then on the production setup. So I decided it's time to have a look into the performance of my OVH resources. Over the time I got access to a couple of them, even some bare metal systems.
For my test I just grabed the following sample:
- VPS 2016 Cloud 2
- VPS-SSD-3
- VPS 2016 Cloud RAM 1
- VPS 2014 Cloud 3
- HG-7
- SP-32 (that's a bare metal with software raid)
Looking into what would be the best way to benchmark I/O it came to my attention, that comparing I/O for cloud resources is not so uncommon. I also learned that dd might not be the first choice but fio seems a good catch for doing lazy I/O benchmarks and ioping for testing I/O latency.
As the systems all running Debian, at least 8.x, I used the following command(s) for doing my tests:
aptitude -y install -o quiet=2 ioping fio > /dev/null; && \
 time fio --randrepeat=1 --ioengine=libaio --direct=1 --gtod_reduce=1 --name=test --output=/tmp/tempfile --bs=4k --iodepth=64 --size=4G --readwrite=randrw --rwmixread=75; \
 rm -f test.*; cat /tmp/tempfile; \
 ioping -c 10 /root | tail -4
The output on my VPS 2016 Cloud 2 system:
Jobs: 1 (f=1): [m(1)] [100.0% done] [1529KB/580KB/0KB /s] [382/145/0 iops] [eta 00m:00s]
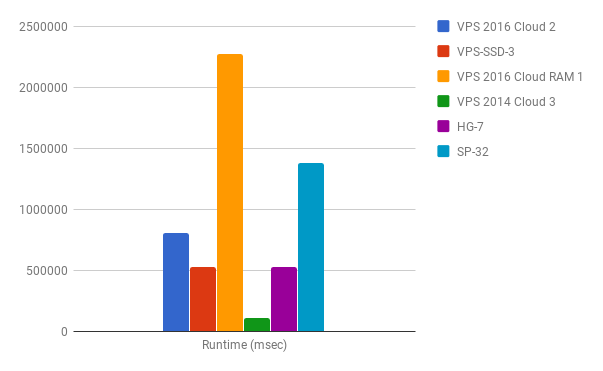
real 14m20.420s
user 0m14.620s
sys 1m4.424s
test: (g=0): rw=randrw, bs=4K-4K/4K-4K/4K-4K, ioengine=libaio, iodepth=64
fio-2.16
Starting 1 process
test: Laying out IO file(s) (1 file(s) / 4096MB)
test: (groupid=0, jobs=1): err= 0: pid=19377: Fri Mar 2 18:16:12 2018
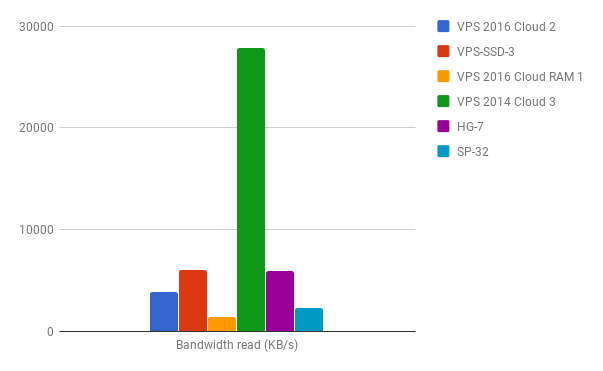
read : io=3070.4MB, bw=3888.9KB/s, iops=972, runt=808475msec
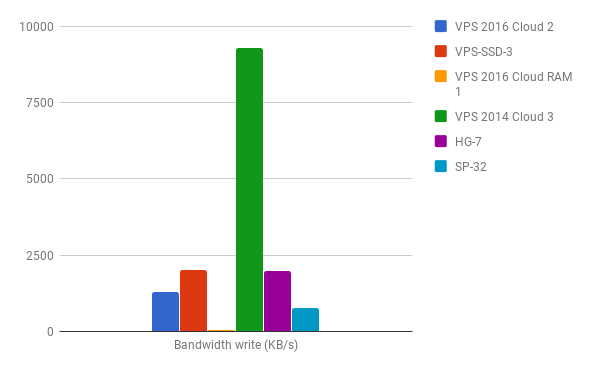
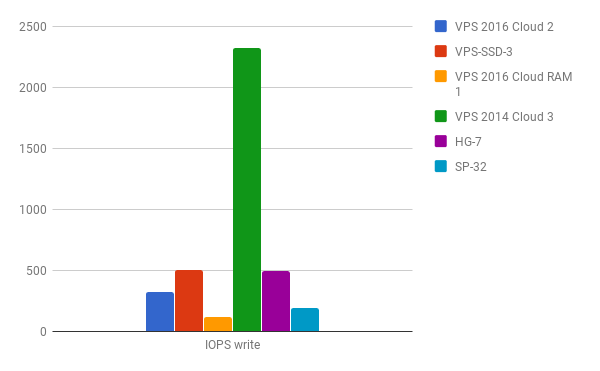
write: io=1025.8MB, bw=1299.2KB/s, iops=324, runt=808475msec
cpu : usr=1.43%, sys=6.34%, ctx=835077, majf=0, minf=9
IO depths : 1=0.1%, 2=0.1%, 4=0.1%, 8=0.1%, 16=0.1%, 32=0.1%, >=64=100.0%
submit : 0=0.0%, 4=100.0%, 8=0.0%, 16=0.0%, 32=0.0%, 64=0.0%, >=64=0.0%
complete : 0=0.0%, 4=100.0%, 8=0.0%, 16=0.0%, 32=0.0%, 64=0.1%, >=64=0.0%
issued : total=r=785996/w=262580/d=0, short=r=0/w=0/d=0, drop=r=0/w=0/d=0
latency : target=0, window=0, percentile=100.00%, depth=64
Run status group 0 (all jobs):
READ: io=3070.4MB, aggrb=3888KB/s, minb=3888KB/s, maxb=3888KB/s, mint=808475msec, maxt=808475msec
WRITE: io=1025.8MB, aggrb=1299KB/s, minb=1299KB/s, maxb=1299KB/s, mint=808475msec, maxt=808475msec
Disk stats (read/write):
sda: ios=787390/263575, merge=612/721, ticks=49277288/2701580, in_queue=51980604, util=100.00%
--- /root (ext4 /dev/sda1) ioping statistics ---
9 requests completed in 4.56 ms, 36 KiB read, 1.97 k iops, 7.71 MiB/s
generated 10 requests in 9.00 s, 40 KiB, 1 iops, 4.44 KiB/s
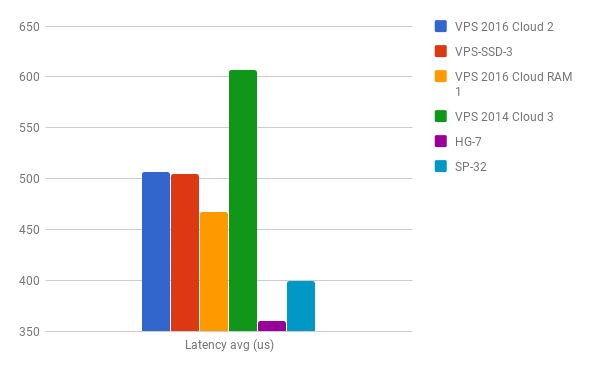
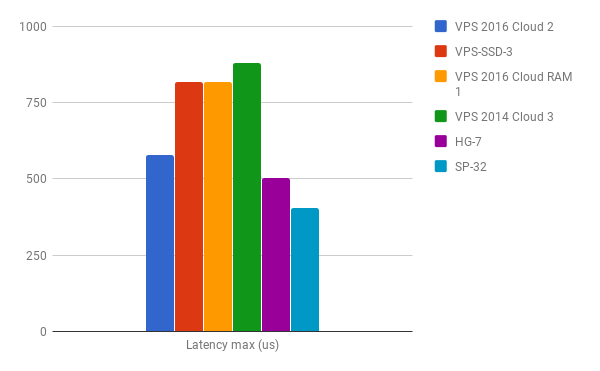
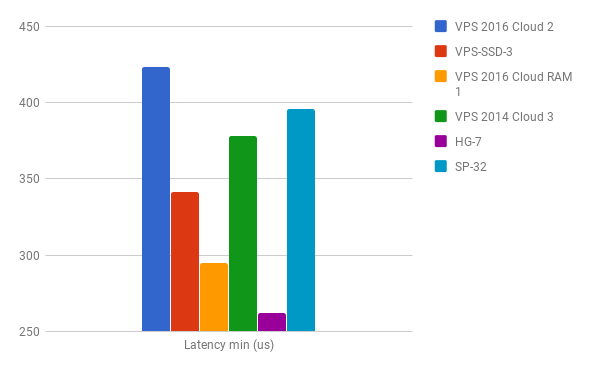
min/avg/max/mdev = 423.4 us / 506.8 us / 577.3 us / 43.7 us
The interesting parts:
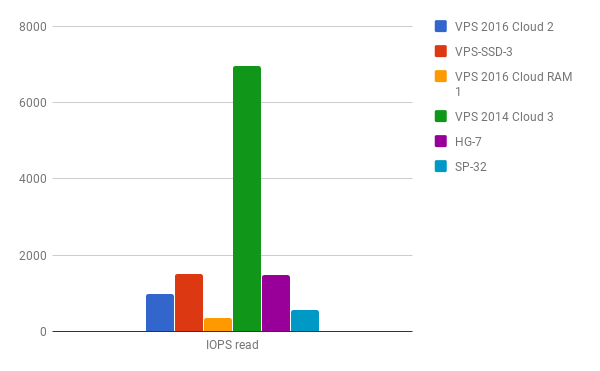
  read : io=3070.4MB, bw=3888.9KB/s, iops=972, runt=808475msec
  write: io=1025.8MB, bw=1299.2KB/s, iops=324, runt=808475msec
min/avg/max/mdev = 423.4 us / 506.8 us / 577.3 us / 43.7 us
After comparing the results with the rest of the systems I think my samples of the VPS 2016 Cloud instances do not convince me that I would choose such a system for use cases where I/O might be a critical part.